

A Hands-on Real-World ML project: Inside a $35K Kaggle competition (pt.1)
Follow this guide and learn how to do a machine learning project step by step


Welcome to the 65th issue of AI Agents Simplified 🍻
This issue is brought to you by HubSpot

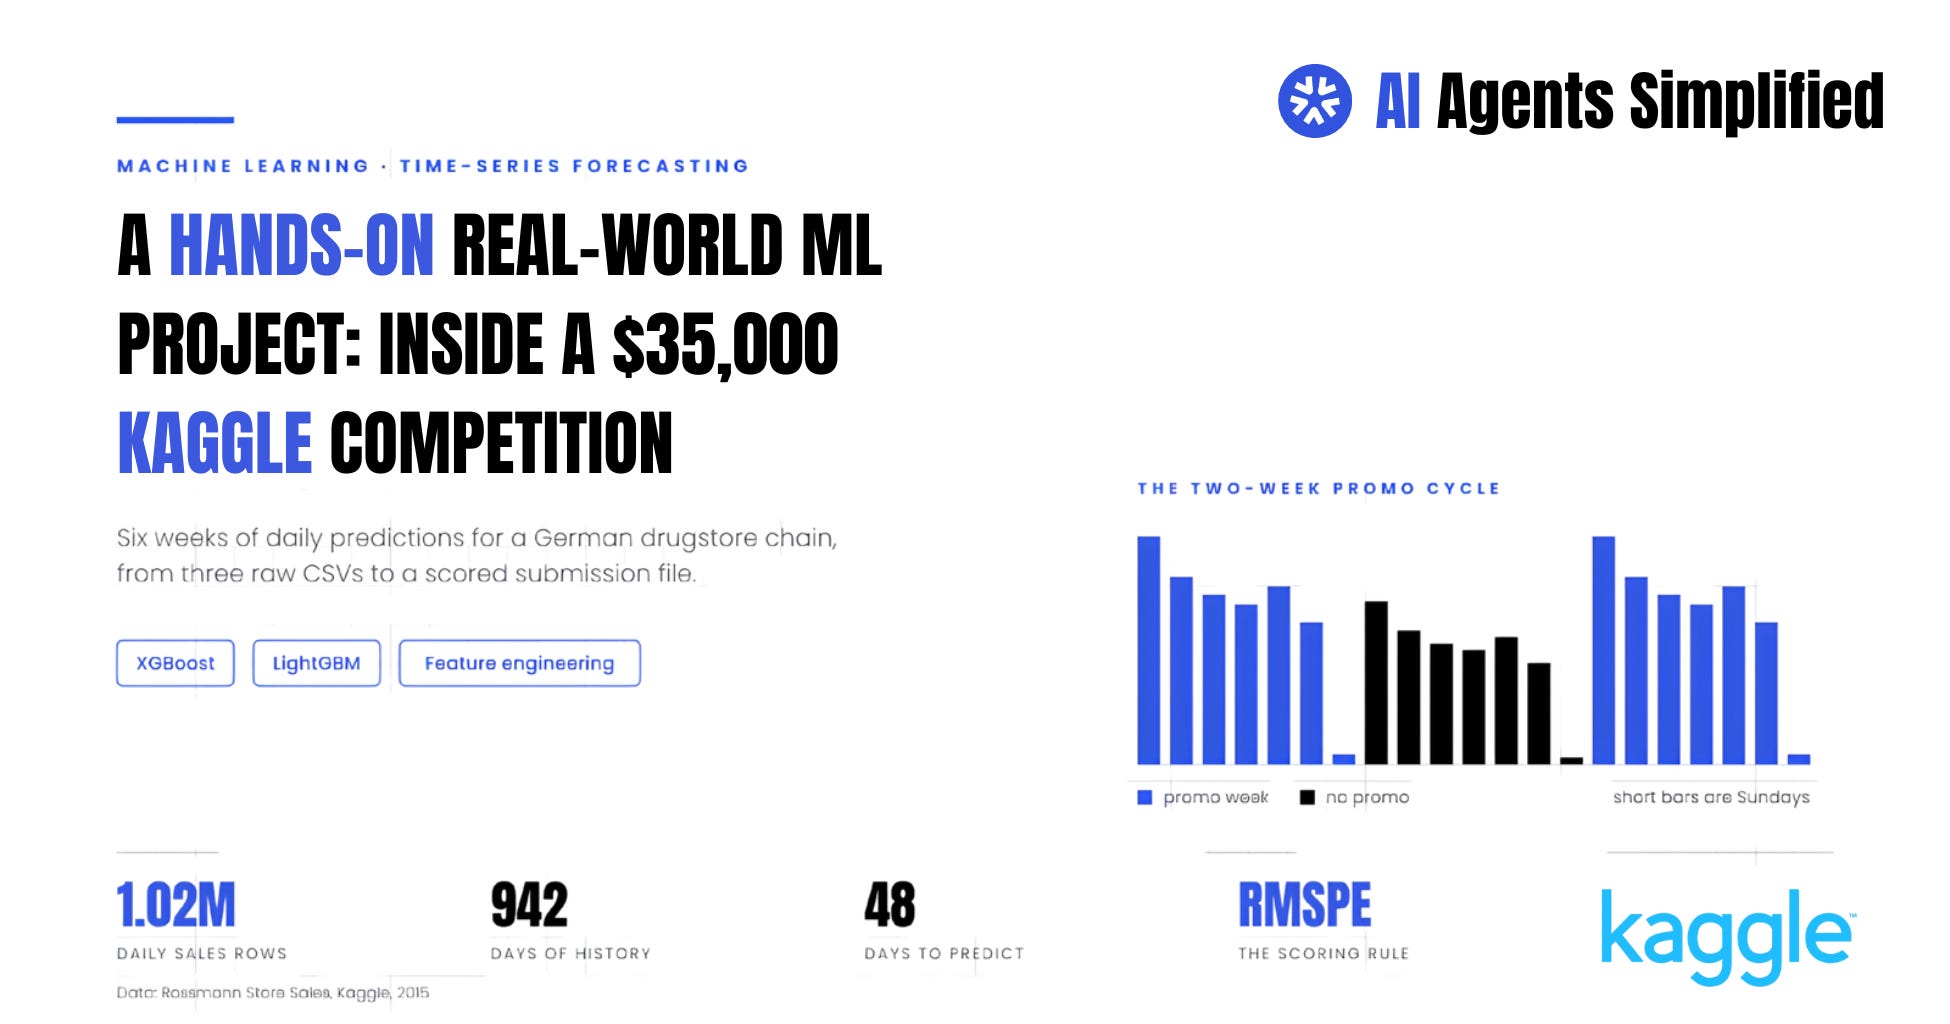
If you've finished Titanic and House Prices and you're looking for something with real impact, the Rossmann Store Sales competition is where I'd send you next. There’s no images text, or GPU required. Just a wide table of dates and store attributes, and a problem that turns out to be much sharper than it looks.
Rossmann is the second largest drugstore chain in Germany. Back in 2015 they put a question to Kaggle that their store managers were already answering by hand every month: what will daily sales look like six weeks from now? Managers were forecasting on gut feel and local knowledge and the quality of those forecasts varied enormously from one store to the next. That variation costs money because staffing rotas and stock orders get built on top of those numbers.
By the end of this post you’ll have a submission file, two working models and a decent sense of why certain choices matter here and others don’t.
Go from AI overwhelmed to AI savvy professional with Superhuman AI

AI will eliminate 300 million jobs in the next 5 years.
Yours doesn't have to be one of them.
Here's how to future-proof your career:
Join the Superhuman AI newsletter – read by 1M+ professionals working at Google, Meta, and OpenAI
Learn AI tools, tutorials and news in just 3 minutes a day
Become the go-to AI expert on your team
Start learning AI now and join Superhuman AI!
The Metric Is The Whole Game
Most tutorials mention the metric and move on. Don’t skip this part because everything downstream follows from it.
Rossmann scored submissions on Root Mean Square Percentage Error. For every store-day you take the error, divide it by the actual sales figure, square that, average across all rows, and take the square root.
The division is the interesting bit. A miss of 50 euros on a day when the store took 500 euros counts ten times as heavily as the same 50 euro miss on a 5,000 euro day. So the quiet little stores in small towns carry far more weight in your score than the big performers, even though they contribute almost nothing to Rossmann’s revenue. If you optimise for plain squared error, you’ll build a model that pours all its effort into getting the busy stores right and gets punished for it.
Two more properties worth knowing. The error is asymmetric! predicting 800 when the truth is 1,000 gives you a percentage error of 0.20, while predicting 1,200 gives you 0.20 as well, but push further and the asymmetry shows. Predict 100 against a truth of 1,000 and you get 0.90, the worst possible outcome. Predict 1,900 and you get 0.90 too but you had to be off by nine times as much in absolute terms to earn it. Under-prediction is cheaper to get wrong in absolute euros, which nudges models toward guessing high.
And the rule that matters most practically:
any store-day with zero sales is thrown out of the scoring entirely.
Closed Sundays, public holidays, refurbishment periods. None of them count. Which means you can predict whatever you like on those days and it won’t touch your score and you shouldn’t waste any model capacity learning them.
Here’s the metric in code, plus the versions the two libraries need:
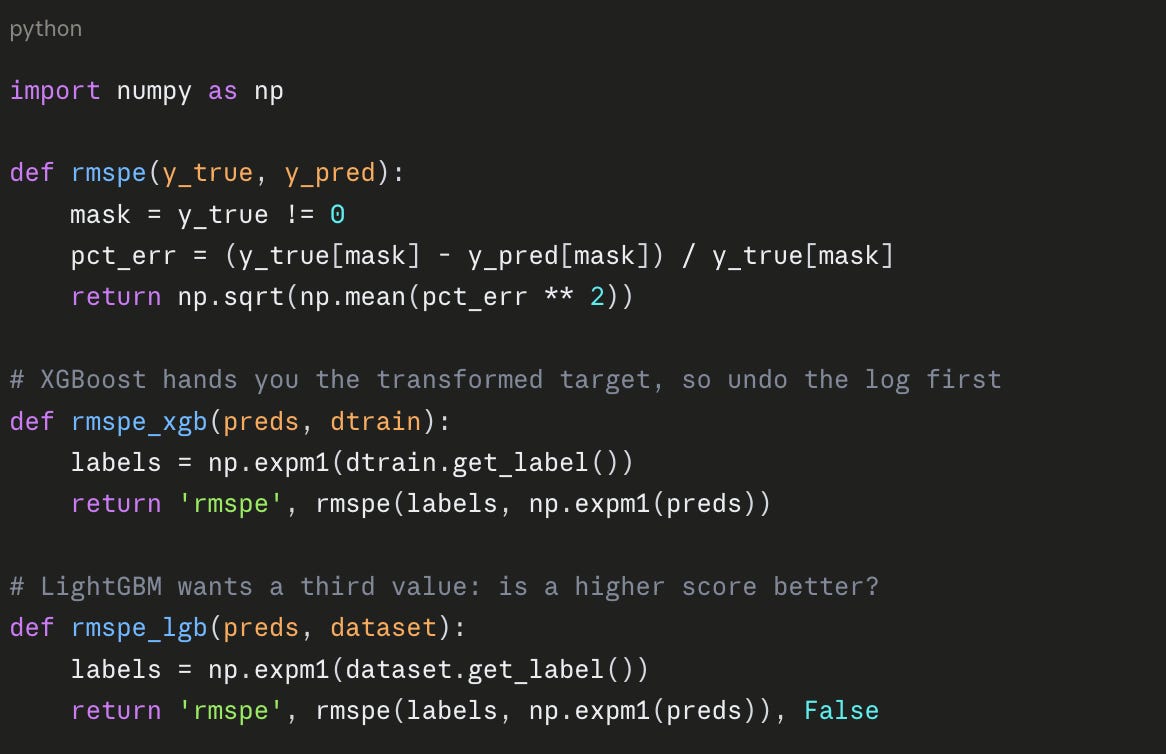
Notice the expm1 calls. We're going to train on the logarithm of sales rather than sales themselves, and it’s because squared error on a log scale is roughly proportional error on the original scale. Taking the log turns the metric we're stuck with into the metric the models optimise natively. It's a one-line change that buys you a lot.
Getting The Data In
There are three files. train.csv has the daily sales history, test.csv has the rows you need to predict, and store.csv has one row per store describing what kind of shop it is.
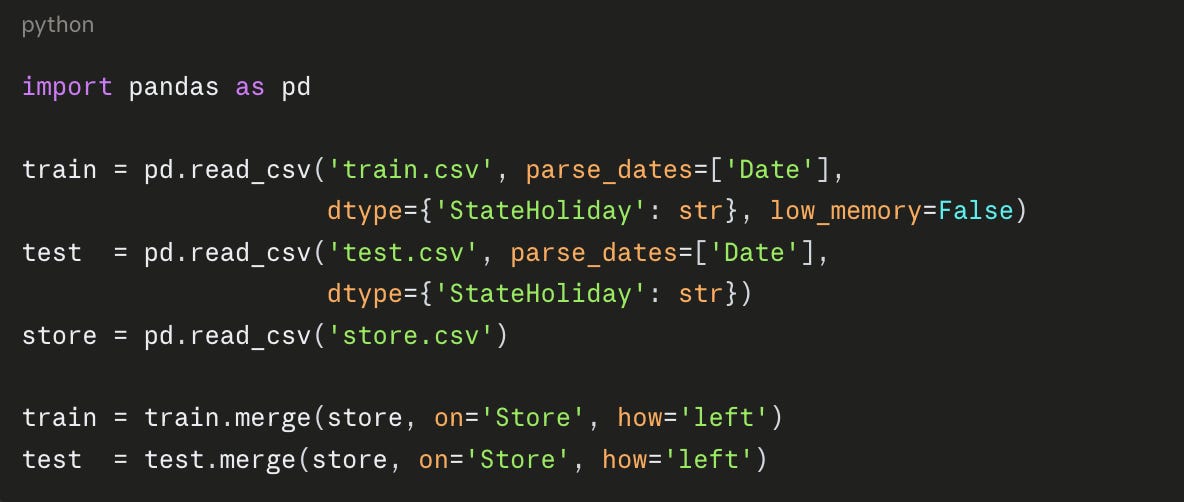
That dtype argument helps you avoid confusion. The StateHoliday column mixes the integer 0 with the strings '0', 'a', 'b' and 'c', so pandas will happily read the same column as two different types in the two files and then refuse to line them up later.
The daily columns are straightforward: Store, DayOfWeek, Date, Sales, Customers, Open, Promo, StateHoliday, SchoolHoliday. The store metadata is where the interesting stuff hides:
StoreType and Assortment, both unlabelled categories (a, b, c, d) telling you the format of the shop and the range of products it carries.
CompetitionDistance, in metres to the nearest competing store, plus the month and year that competitor opened.
Promo2, a longer-running promotion some stores joined, with the week and year they signed up and a PromoInterval string listing which months it runs in.
Two things about test.csv to note now. It has an Id column that your submission has to preserve. And it does not have a Customers column, which is going to matter more than you’d expect.
Turn AI into Your Income Engine
Ready to transform artificial intelligence from a buzzword into your personal revenue generator? Our groundbreaking guide "200+ AI-Powered Income Ideas" is your gateway to financial innovation in the digital age.
Inside you'll discover:
A curated collection of 200+ profitable opportunities spanning content creation, e-commerce, gaming, and emerging digital markets—each vetted for real-world potential
Step-by-step implementation guides designed for beginners, making AI accessible regardless of your technical background
Cutting-edge strategies aligned with current market trends, ensuring your ventures stay ahead of the curve
Download your guide today and unlock a future where artificial intelligence powers your success.
Your next income stream is waiting.
Looking At The Data Before Touching a Model
Rather than going through dozens of charts, I'll focus on four plots that changed how I built this and what each one taught me.
1.Sales distribution
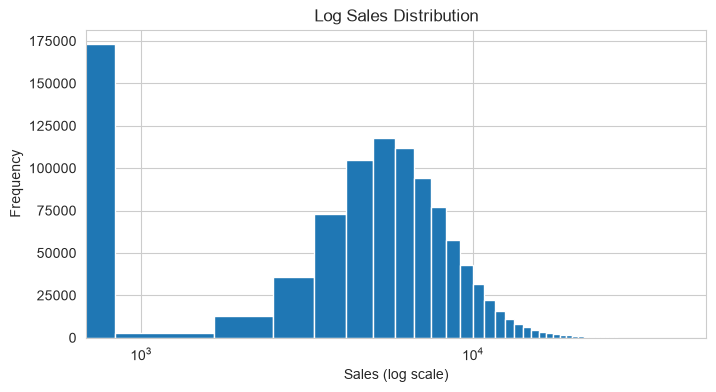
There’s an enormous spike at exactly zero, roughly 17% of all rows. Cross-reference with Open and it’s obvious: those are closed days. Sunday closures mostly, plus holidays.
2.Sales by day of week
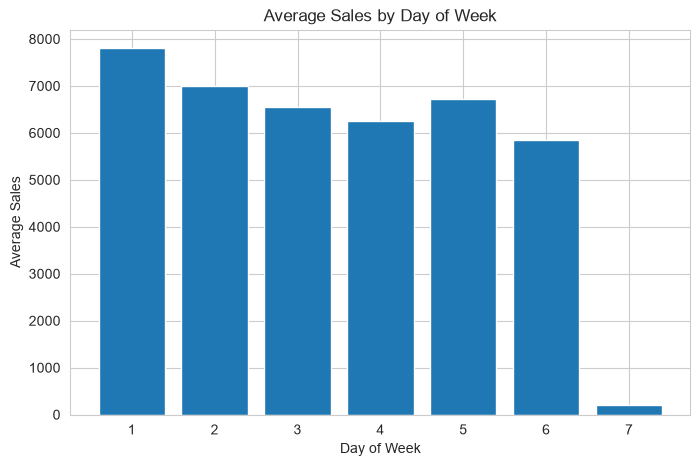
Monday is the busiest day by a clear margin, then it slopes downward through the week. Sunday is near-empty because most stores are shut, but a small group of stores does open on Sundays, and those stores behave differently enough that a model needs the store identity to make sense of them.
3. Sales by promo flag
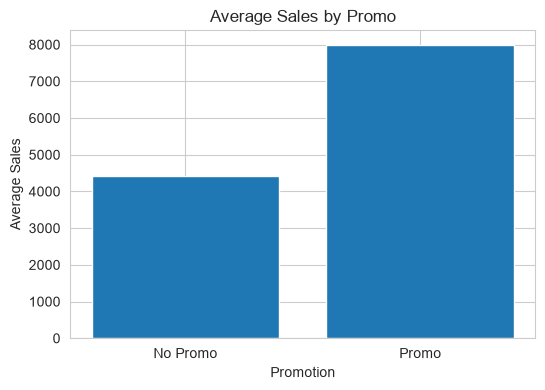
A promotion lifts a typical day by somewhere in the region of 20 to 30%. Plot promo over time for a single store and you’ll see it running every other week in a regular cycle. That two-week rhythm is real and the model will pick up on it.
4. Sales over the full time span
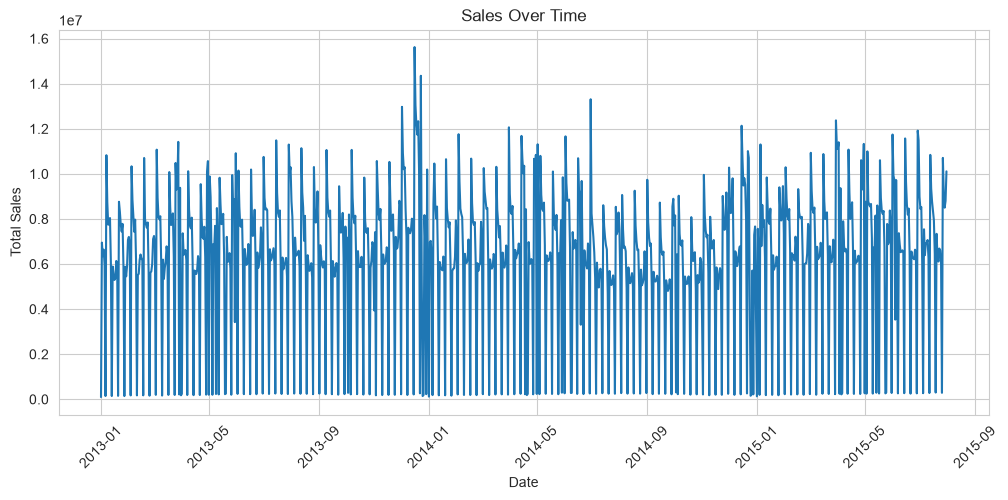
Most stores are remarkably flat. There’s a hard December spike and a matching January lull, but very few stores show a strong multi-year trend. That’s useful, because it means we can lean on per-store historical averages without worrying much about them going stale.
Then there’s the plot that looks like great news and isn’t. Sales against Customers is almost a straight line, correlation around 0.82. Which stands to reason. More people through the door, more money in the till.
Three Hidden Traps!
These are the ones I want you to see coming, because each of them will quietly cost you and none of them throws an error.
The Customers Column Is Unusable
It’s the single strongest predictor in the training set and it does not exist in the test set. You’ll never know how many people walked into store 431 on 3 September 2015, because that’s the same unknown future you’re trying to forecast. Feed it to a model and your validation score will look wonderful right up until you try to predict on the test rows and discover you don’t have the column.
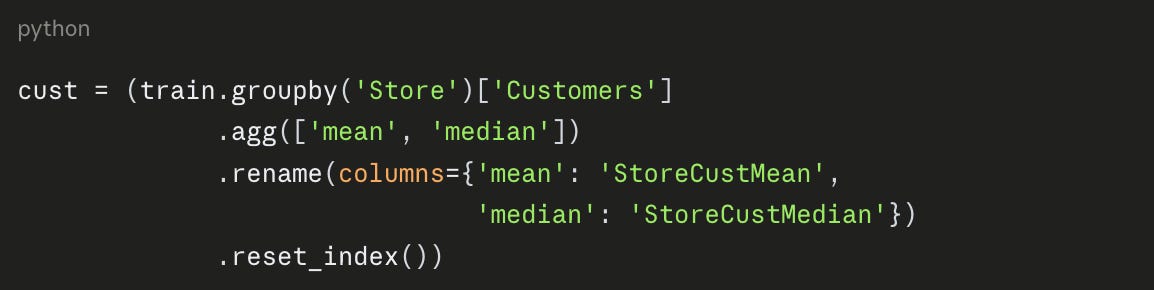
You can’t use it directly but you don’t have to throw it away either. Historical customer levels per store are a legitimate feature since they describe the store rather than the day:
180 Stores Are Missing Half a Year
Count the rows per store and you'll find two clusters:

A complete history is 942 days. But 180 stores only have 758, and the 184 missing days are all of July through December 2014. Rossmann never explained the gap in the data itself; the working theory on the forums at the time was refurbishment.
This is nasty precisely because it’s invisible. Any per-store average you compute is silently built from a different time window for those 180 stores, one that happens to exclude the entire Christmas period. If you’re computing seasonal features, you now have 180 stores whose December behaviour you’ve never observed. At minimum, know which stores they are.
Random Splits Lie to You About Time Series
The reflex is train_test_split(X, y, test_size=0.2). Please don’t, not here!
A random split scatters your validation rows throughout the same 31 months as your training rows. So for almost every validation row, the model has already seen the days immediately either side of it. Predicting Wednesday when you’ve been shown Tuesday and Thursday is a much easier exercise than the one Kaggle actually set, which is predicting six weeks with nothing in between to anchor you.
Build a holdout that copies the real task instead. The last six weeks of training data, held back:

The score you get from this will be worse than the score from a random split. It will also be roughly true, which is the entire point. Every decision from here gets judged against this holdout.
Building Features
First, cut the rows we don't need:
….
If you’re finding this post helpful so far, I’d love to hear your feedback. Leave a comment and let me know what you’d like me to cover in the second part so I can make it as valuable as possible.
Let’s Collaborate
Hey there, I’m Hana, co-founder and technical writer at AI Agents Simplified. If you’re building in the AI space, have feedback on today’s post, or want to explore a collaboration, let’s chat! You can find me on LinkedIn or drop me an email. I read every message and would love to hear from you.
The Customers-column trap is the one that'll bite people hardest — it's the strongest predictor in train and it's gone in test, so a validation score built on it just lies to you until submission day. That's a sharper trap than the usual leakage warnings because it doesn't look like leakage, it looks like a legitimate feature you forgot to drop.